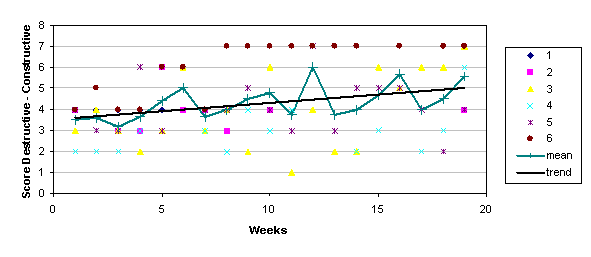

The figure concerns the analysis of data collected during a 19-week behavioral therapy program for psychiatric patients. This data was collected during weekly group therapy sessions. The program started with 6 patients. Attendance in the program was not complete, the patients attended a median of 16 sessions, one patient exited after eight sessions while another patient stopped attending after coming to 8 sessions within the first 10 weeks. Four of the six attended for more than 15 sessions.
To describe the change in the group's weekly ratings of aspects of the session and their symptoms continuous time ARMA was used (Jones & Ackerson, 1991; Jones 1993). This model accounts for the varying attendance rates over the 19 weeks as this technique enables analysis of data were a different number of measurements is made on each study subject at different points on a continuous time scale. Linear trends that indicate change over time and the statistical significance of the trend can be estimated using this method. The module 'growth' available in the computer program "R" was used for the analysis ().
CARMA modeling indicates that the clients' weekly assessment of the constructiveness of their emotions (see the figure) indicates a significant pattern of improvement (B=0.08434, z= 2.7844; p=0.00536).
Jones, R. H., Ackerson, L. M. Serial correlation in unequally spaced longitudinal data. Biometrika. 1991, 77, 721-731.
Jones, R.H. Longitudinal Data Analysis with Serial Correlation: A State-space Approach. London: Chapman and Hall. 1993.
Other examples: seasonality in alcohol use; increasing hospital admissions