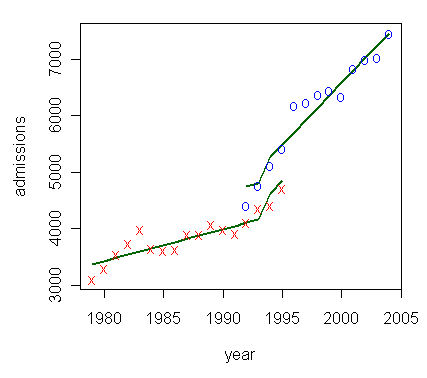

The figure was made to answer the question to what extent the introduction of a new mental health act in The Netherlands in 1994 has led to an increase in the number of involuntary psychiatric admissions. Two data sets are available, for the period 1979-1995 the mental health patient registration data ("x" in the graph), and for the period 1992-2005 the medical inspectorate data ("o").
The analysis is done in "R" (). A GLM model, linear regression, poisson error is used. In the model the slope of the regression line and the immediate effect of the change in the mental health act is set to produce the same values for both data sets. The model estimates the change in the slope before and after the change in the mental health act. In "R" notation the resulting GLM model looks like this:
glm(admissions~dataset+year*before_or_after_1994, family=poisson(link=identity),dataname)
The figure above is also produced using "R", using the following format:
matplot(year,admissions,type="llpp",cex=1,pch="xo",lwd=2,col=c("darkgreen","darkgreen",2,4),lty=1)
The figure shows that immediately after the introduction of the new mental health act the number of involuntary psychiatric admissions increased with 250.8. Average growth in the number of admissions increased from 56.2 per annum before 1994 to 218.6 per annum from 1994. Because there is overlap between the two data sets the difference in registering psychiatric admissions can be estimated. In the mental health patient registration data there were on average 639.2 less involuntary psychiatric admissions registered each year compared with the medical inspectorate data.
Mulder C.L., Broer J., Uitenbroek D., van Marle P., van Hemert A.M., Wierdsma A.I. Een versnelde stijging van het aantal inbewaringstellingen na de invoering van de Wet BOPZ. Nederlands Tijdschrift voor Geneeskunde2006; 150(6):319-22.
Other examples: seasonality in alcohol use; changes during a group therapy programIn Italia, Trade GPT sta cambiando il modo in cui i trader interagiscono con il mercato. Non perdere l'opportunità di essere parte di questa innovazione.